After the UK voted to leave the EU it was widely reported that there was an increase in hate crime. I was initially fairly sceptical of this and thought that a large proportion of this increase was likely to be explained by individuals being more likely to report crimes committed against them as hate crimes. For example if individuals believed that the Brexit campaign involved significant levels of xenophobic rhetoric they might be more likely to interpret crimes committed against them as being racially or religiously motivated. This effect would likely be compounded by reporting programmes like True Vision. In addition, the hate crime increase appeared to affect LGBT people despite the Brexit campaign barely touching on LGBT issues – leaving no clear causal link between Brexit and the increase in hate crimes committed against LGBT individuals.
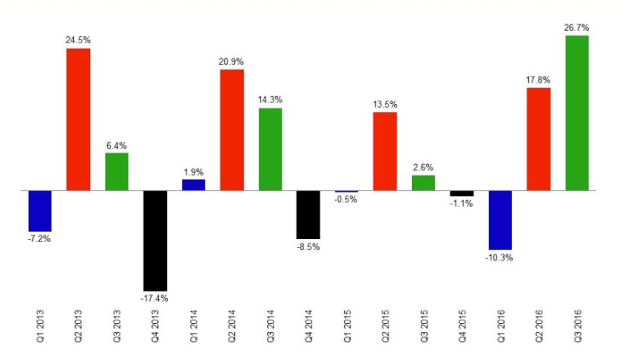
The chart below shows quarter on quarter changes in hate crime across England and Wales. There appears to be some degree of seasonality. As a result even though there was an increase in hate crime in the quarter leading up to and including the period immediately after the vote (Q2 – April-June), this appears unremarkable compared to the similar quarter on quarter changes in previous years. What does stand out is the period after that (Q3 – July-September), where the increase in hate crime was larger than usual.
The task of disentangling whether the increase was real or driven by reporting is a non-trivial one – at first glance both might equally explain the change. If we assume that some small but fixed proportion of Brexit supporters committed these crimes then we would expect to see regional variation in the increase in hate crime related to the proportion of people voting for Brexit. If the change was driven by reporting we would probably expect to see a more uniform change across the country (although might still see some effect, if people in predominantly Leave supporting areas were more likely to be worried about hate crime and flag crimes within this category or if police forces tended to prompt individuals in these regions more about potential hate crime links).
The police crime and outcomes data are reported on the basis of Police Authorities, which can then be used as a basis to aggregate the Brexit referendum results data. All crimes which are listed as “religiously or racially aggravated” are tagged as hate crimes. The City of London is excluded from this analysis as the profile of the small number of residents who live there likely differs substantially from that of the individuals who work or visit the square mile. Running a regression of the Q3 proportional increase in hate crime on the proportion voting Brexit produces the following results:
HATECRIME16Q3 = -0.279 + 1.061*LEAVE
se: (0.387) (0.696)
The relationship is statistically insignificant (p=0.14) although this isn’t entirely surprising given the low number of observations able to be used for this analysis (n=42). Furthermore the proportion voting Brexit only appears to explain around 6% of variation in hate crime – which suggests that this is not an overwhelming driver. Although this doesn’t meet conventional levels of statistical significance these results do at least suggest that there is more likely to be a correlation than not.
There are however a few major cautions in believing even this limited story. First if you look at the quarter leading up to Brexit when most of the supposedly “toxic” campaign rhetoric emerged there is no correlation between the increase in hate crime and the regions that voted leave:
HATECRIME16Q2 = 0.391 – 0.235*LEAVE
se: (0.370) (0.665)
Secondly if you look at the quarter-on-quarter increase in hate crime in Q3 there is a much more substantial correlation with voting for Brexit for 2015 than 2016, when the campaign actually happened. This result is statistically significant (p=0.014) and explains a greater proportion of variation than the subsequent year (R^2 = 0.142 as compared with R^2 = 0.055). As a result it may be the case that there are other reasons for variation in hate crime that happen to correlate with voting Leave but are unrelated to the Brexit vote itself:
HATECRIME15Q3 = -0.632 + 1.277*LEAVE
se: (0.276) (0.497)
This is clearly insufficient to give a definitive answer on what caused the increase in hate crime. However it suggests that at the very least the story is a lot more complicated than the one that we have been left to infer – that Brexit supporters whipped up by xenophobic rhetoric went on to commit these crimes. There may of course be reasons why those most likely to commit hate crimes were more evenly distributed than Leave voters – although these don’t seem immediately obvious.
